

NSR is releasing the fourth edition of their Satellite Capacity Pricing Index, 4th Edition (Q1, 2018). This is the only report available to incorporate pricing inputs from throughout the value chain, that includes end-users who lease capacity, and is the guide for satellite capacity pricing.
NSR’s Satellite Capacity Pricing Index, 4th Edition (Q1, 2018) is maintained by NSR to be the longest running and most accurate picture of satellite capacity pricing available. As the only report available to incorporate pricing inputs from throughout the value chain, including the end-users who lease capacity, NSR's SCPI4 is a helpful guide for satellite capacity pricing.
NSR’s Satellite Capacity Pricing Index, 4thEdition (Q1, 2018) examines the key question facing the satellite industry: How much does satellite capacity cost, both now and in the future? With proprietary modeling and source information from satellite operators, service providers and end-users, NSR’s Satellite Capacity Pricing Index, 4th Edition (Q1, 2018) offers a detailed analysis of capacity pricing, evolution of price in various verticals, and the future state of the market.
The satellite industry is in the midst of a general decline in capacity pricing, as supply increases, competition intensifies, and demand lags in certain markets. This state of play presents key areas of concern for operators around quantifying the market index lease price and what range of pricing can be expected both now and in the future. However, it also presents opportunities for buyers as lower priced capacity opens new business models and applications. NSR’s Satellite Capacity Price Index, 4th Edition (SCPI4) analyzes both the buyer and seller angles and provides a detailed pricing assessment critical to all within the satcom leasing market.
Key Questions Answered in this Report:
- When will the pricing decline bottom out?
- How are various verticals converging or diverging on pricing, and what has been the historical percentage drop in pricing? Will this continue to be the case?
- What is the anticipated decline for GEO-HTS pricing, and will LEO capacity have any impact in the near term?
- What are the current Consumer Broadband prices, and how do they compare to Backhaul and Trunking prices?
- What strategies are operators adopting to limit the price decline?
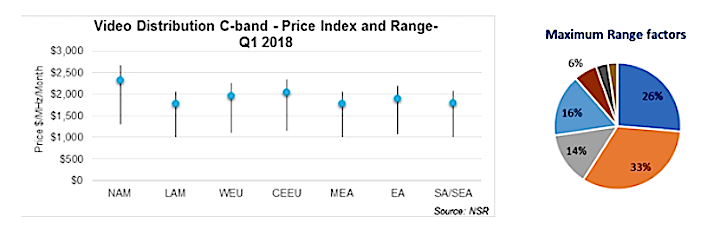
- How stable is the video market in terms of pricing?
- How big an effect does the value chain and downstream players have, and how do the bulk deal dynamics influence capacity prices?
- Bottom Line: What is the historical, current and future state of capacity pricing, and how is it expected to change with more supply coming into orbit?
NSR’s SCPI4 combines base price and factor-based inputs from regional operators, Big Four operators, service providers, and end-users to provide an even, balanced and well-rounded view of pricing within the industry. Expanding on NSR’s Q3, 2017 edition of this study, this most recent edition provides the historical price index and a global mean price index along with the current spot prices/range and introduces a new methodology for the price forecast.
SCPI4 includes pricing matrices on traditional FSS C-band, FSS Ku-band, and GEO-HTS and standalone Ka-band HTS capacity for Q1 2018, segmented regionally across 10 regions, and by applications across
- Video Distribution
- DTH
- Enterprise
- Trunking/Backhaul
- Broadband
- Mobility
- Government-Military segment
Beyond this, NSR quantifies a range of pricing with standard deviation backed by anchor criteria, thus providing bound estimates for various combinations of factors such as contract duration, amount of capacity (small/large customer), fill rates, and customer retention discounts. In addition to pricing ranges, NSR also includes significant qualitative analysis on both existing prices and the market expectations one year into the future.